Debugging ETABS plugins in Visual Studio
Computers and Structures Inc. has included an API to programmatically control or extend ETABS for a while now, and I have spent some time playing around with it, albeit at a pretty basic level.
This post summarizes a few tips for debugging ETABS plugins written in C# using Visual Studio. I used the 2019 Community Edition for this.
Tip 1: Set up Debug configurations
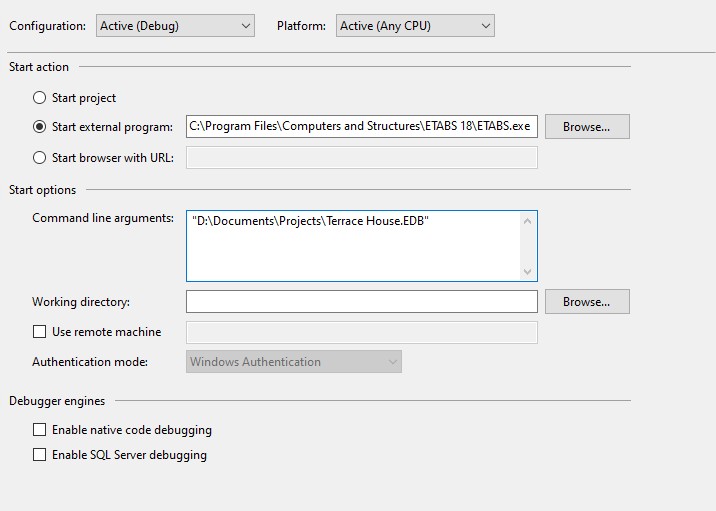
The configuration manager for your solution can be opened from the menu Project > {Your Project Name} Properties or by clicking the dropdown beside the Start button.
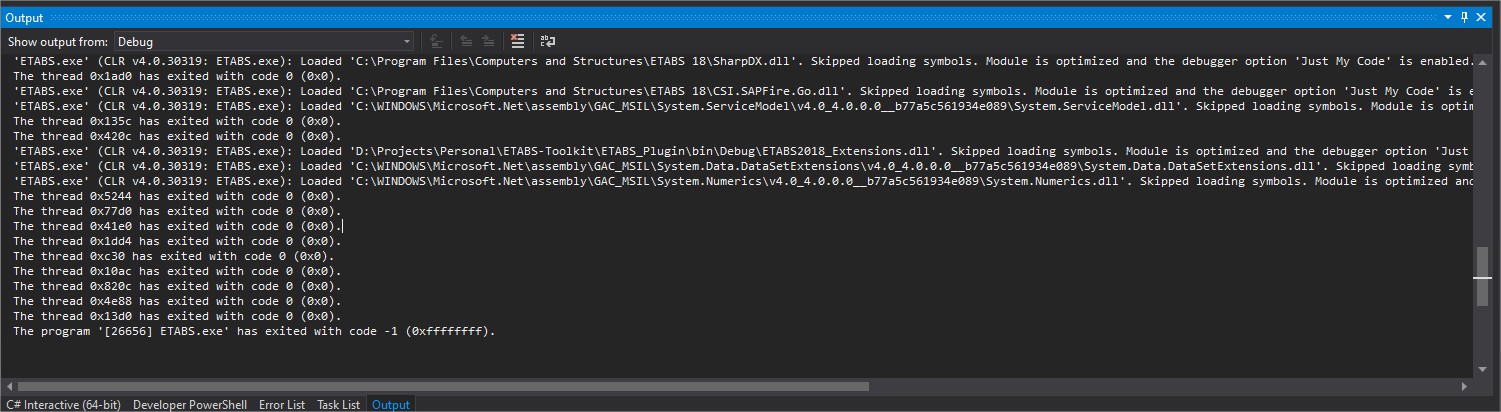
From here, you can set up one or more different debug configurations. As shown in the screenshot below, I have instructed VS to start ETABS 18. Furthermore, I pass an optional command line argument of the filepath to an existing model. With this configuration, when I hit the run button VS will open that model in ETABS, and I will be able to view some of the output stream in the VS Output window. The Output window is a potential source of useful information when errors are encountered.
Tip 2: Use git
Please don’t rely on undo / redo for code. Use git. There are many excellent introductory guides for git. Here is a short primer by Github: https://guides.github.com/introduction/git-handbook/.
When you have a working plugin (for example, starting from my Plugin Starter Kit) and you decide to add or remove code, you should commit the codebase first. Then work on your feature. Then Test. Then commit the working and tested code. This will save you from the all-too-common situation of having a project that wont compile, and no way back to the last known working state.
Tip 3: Use breakpoints
When an error is encountered in your code, the plugin will crash, a warning will appear about encountering an abnormal condition, ETABS will close, and you will be left wondering where it all went wrong. Luckily, you can use some strategically placed breakpoints to focus in on the problematic code. What works well for me is to place a breakpoint inside any new feature/method I’m working on. Then I can step through the code and inspect the values of my variables.
Tip 4: Use Debug.Assert()
The built-in Debug.Assert() and Debug.WriteLine() are imported from System.Diagnostics. They can be used to write information to the Output window conditionally, or absolutely. For instance, all the ETABS oAPI methods return a status code ret. When ret != 0, something went wrong. So you can give yourself some information by inserting code such as:
private string[] MyMethod(ref cSapModel SapModel)
{
    ret = SapModel.AreaObj.SetPier(myObjectName, myPierName)
    Debug.Assert(ret == 0, $"Failed to assign label {myPierName} to {myObjectName}")
}
These are a few tips that have worked for me. Feel free to get in touch with any further tips that work for you.
-Jeremy
Jeremy Atkinson
Structural Engineer
My interests include tall buildings, seismic design, and computer programming.